A strategic look at where real value is created in the new era of AI-driven work.
For the past fifteen years, we’ve lived in a world of Systems of Navigation. To understand our business, we navigated: we opened a tab for Jira to check project status, another for a Google Doc page for a spec, a dashboard in Datadog for performance, and a spreadsheet fed by CSV exports for a holistic view. Leadership meant being an expert navigator, a human data-aggregator.
That era is ending.
We are now entering the age of Systems of Execution. A new class of AI agents we can call them “Doers” is emerging. These systems don’t just show you where the work is; they understand your intent and do the work for you.
In the same way Google aggregated content and became the front door to the internet, these Doers will aggregate tasks and become the front door to organizational work. The implications are profound.
The Inevitable Commoditization of Yesterday’s Darlings
What happens when an AI agent can prepare a full Q3 strategy review by pulling data from Jira, Google Doc, Calendar, and Slack without you ever opening those applications?
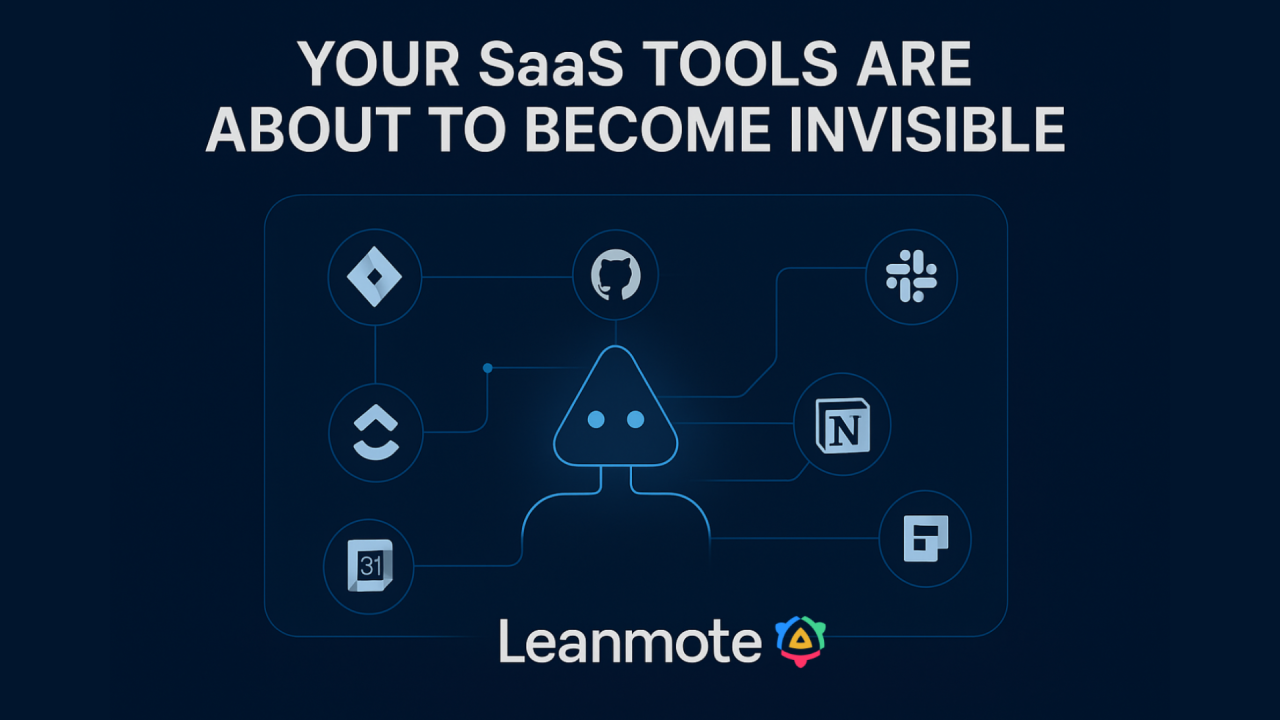
The applications themselves become commoditized “headless databases.”
They become invisible utilities, relegated to being the system of record where the data is stored, but they lose control over the user interface, the user relationship, and ultimately, their strategic value. Their brand and loyalty erode because the user’s primary relationship is now with the Doer, not the underlying app.
For a leader, this means the static dashboards you rely on today are about to become obsolete. They are a rear-view mirror connected to engines nobody looks at anymore. A reactive report on invisible data is a recipe for being left behind.
The Real Question: If Not Dashboards, Then What?
So, if the value is no longer just in the raw data stored in these systems, where does it now reside?
Value has moved up the stack. It now lives in the Intelligence and Orchestration Layer.
The critical work for a leader isn’t raw data retrieval. The real work is:
- Synthesis: Understanding how a change in a GitHub repository connects to a conversation in a Slack channel.
- Diagnosis: Identifying the real root cause of a delay, which is rarely in the Jira ticket itself but often hidden in team dynamics or process bottlenecks.
- Prescription: Knowing the specific, actionable steps to take to resolve an issue before it becomes critical.
This is the strategic ground where leaders create value. And it’s precisely this layer that traditional tools are completely blind to. Where are we heading with Leanmote?
Leanmote: The New Command Center for Leadership
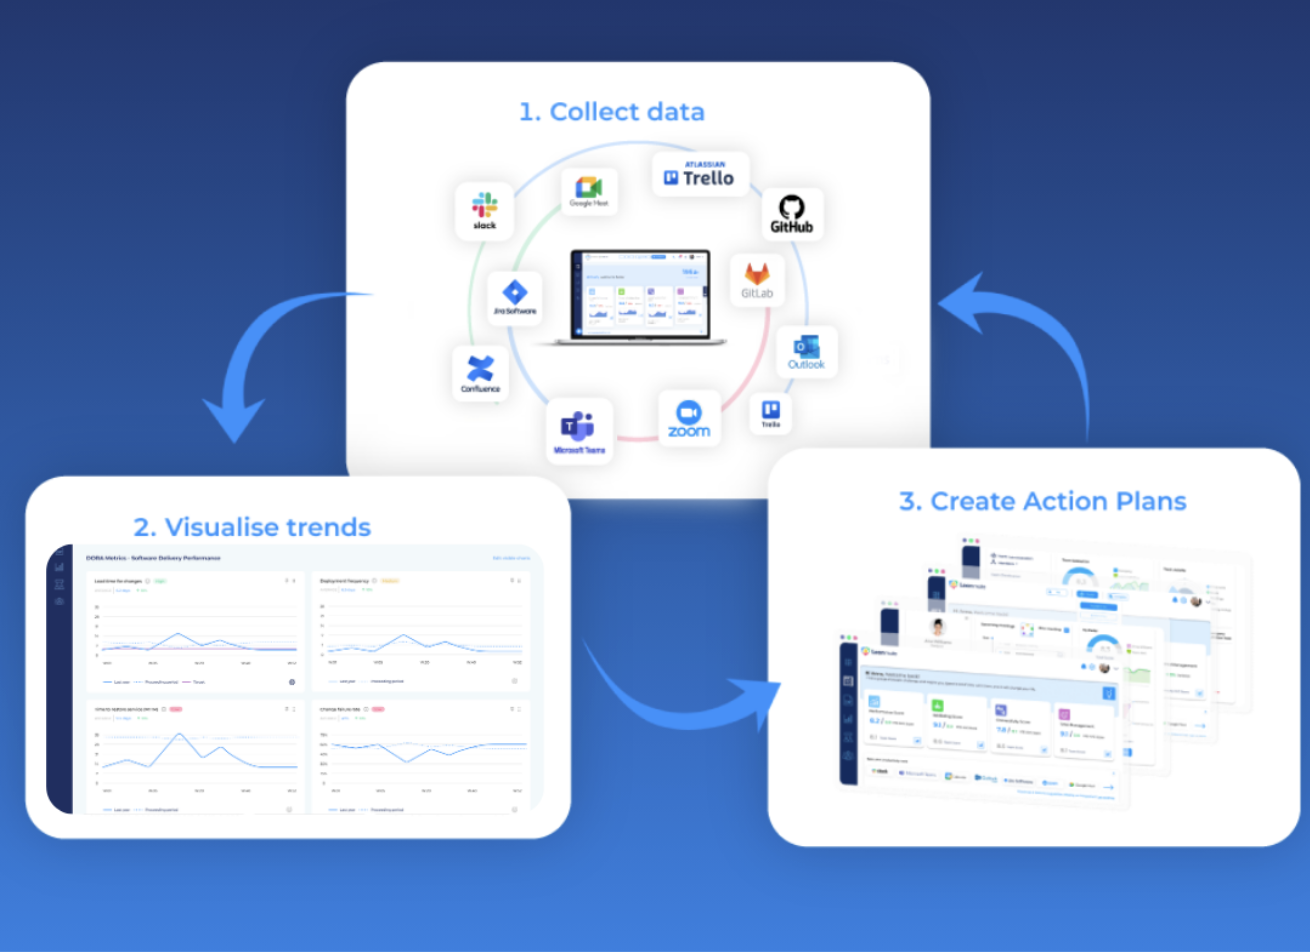
This brings us to the value of a tool like Leanmote. Leanmote was built for this new reality. It is not just another dashboard to navigate; it is the Intelligence and Orchestration Layer for engineering leadership.
Leanmote operates on the principles of the “Doer” era:
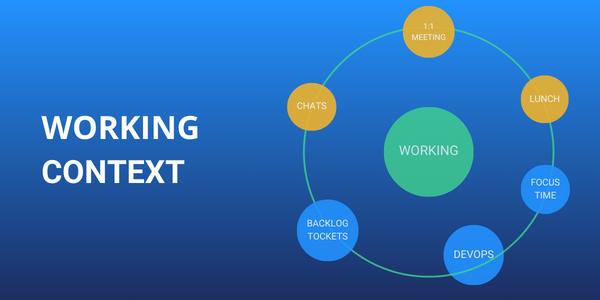
- It Unifies Holistically: It doesn’t just look at Jira. It uniquely connects the code (GitHub) to the context of the conversation (Slack, Teams) and the allocation of time (Calendars). It sees the complete picture that individual tools and the new generalist AI agents miss.
- It Diagnoses, It Doesn’t Just Display: While other tools show you a red metric, Leanmote’s AI acts as your co-pilot to find the why. It builds an Organizational Network Map to detect the human bottlenecks, the communication silos, and the process friction that are the true source of delays.
- It Prescribes, It Doesn’t Just Present: This is the crucial final step. Leanmote doesn’t leave you with a chart and expects you to figure it out. It delivers clear, prioritized action plans. It moves you from passive analysis to active, intelligent execution.
The future of strategic decisions will not flow through dozens of browser tabs or a manually updated spreadsheet. That’s the old world of navigation. The future will be orchestrated from a central command center that provides unified intelligence and prescriptive guidance.
That is the future Leanmote is building.
#FutureOfWork #AI #SaaS #Leadership #CTO #EngineeringManagement #DigitalTransformation #Leanmote #TechLeadership