Google Calendar

Turn your meetings into actionable collaboration insights

Leanmote connects to Google Calendar & Meet to give leaders a clear view of how meetings impact team performance and costs.

  • Understand if meetings help collaboration or create unnecessary overhead.
  • Detect how much focus time teams actually preserve.
  • Measure meeting load, costs, and participation patterns automatically.
  • Back leadership decisions with data, not guesswork.

🔗 Why Leanmote for Calendar & Meet?

Google Calendar tells you when a meeting happens — but not its impact.
With Leanmote, every scheduled and recurring meeting is transformed into metrics that show the real cost and efficiency of collaboration:

  • Time lost in recurring or large meetings.
  • Distribution of focus vs. meeting time.
  • Alignment between teams through connectivity graphs.
  • Early detection of overload on certain individuals or groups.

⚡ Real-Time Sync

Once connected, all meetings are automatically analyzed:

  • Meeting Hours – Track total time invested in meetings.
  • Focus Time – Measure uninterrupted time left for deep work.
  • Meeting Duration – Spot if meetings run too long.
  • Recurrent Meetings – Detect patterns that eat into productivity.
  • Large Meetings – Identify sessions with too many participants.
  • Meeting Costs – Estimate the hidden cost of meetings in work hours.

All data is updated continuously, without any manual reporting.


🌍 Benefits for Your Organization

  • Boost Productivity: Reduce unnecessary recurring and large meetings.
  • Protect Focus: Ensure deep work time isn’t fragmented.
  • Lower Costs: Quantify and cut down on wasted meeting hours.
  • Strengthen Collaboration: See how teams connect and where silos exist.

📌 Typical Use Case

A data engineering team spends 8–10 hours weekly in coordination calls. With Leanmote:

  1. Meeting patterns are automatically tracked from Google Calendar.
  2. Dashboards highlight that 40% of time is lost in recurring sessions.
  3. Leaders spot overloaded connectors and reduce meeting frequency.
  4. The team recovers focus time, improves delivery speed, and lowers coordination costs.

👉 The outcome: fewer but more effective meetings, better collaboration, and lower costs.

Google Meet

Turn your meetings into actionable collaboration insights

🚀 Value Proposition

Leanmote connects to Google Calendar & Meet to give leaders a clear view of how meetings impact team performance and costs.

  • Understand if meetings help collaboration or create unnecessary overhead.
  • Detect how much focus time teams actually preserve.
  • Measure meeting load, costs, and participation patterns automatically.
  • Back leadership decisions with data, not guesswork.

🔗 Why Leanmote for Calendar & Meet?

Google Calendar tells you when a meeting happens — but not its impact.
With Leanmote, every scheduled and recurring meeting is transformed into metrics that show the real cost and efficiency of collaboration:

  • Time lost in recurring or large meetings.
  • Distribution of focus vs. meeting time.
  • Alignment between teams through connectivity graphs.
  • Early detection of overload on certain individuals or groups.

⚡ Real-Time Sync

Once connected, all meetings are automatically analyzed:

  • Meeting Hours – Track total time invested in meetings.
  • Focus Time – Measure uninterrupted time left for deep work.
  • Meeting Duration – Spot if meetings run too long.
  • Recurrent Meetings – Detect patterns that eat into productivity.
  • Large Meetings – Identify sessions with too many participants.
  • Meeting Costs – Estimate the hidden cost of meetings in work hours.

All data is updated continuously, without any manual reporting.

🌍 Benefits for Your Organization

  • Boost Productivity: Reduce unnecessary recurring and large meetings.
  • Protect Focus: Ensure deep work time isn’t fragmented.
  • Lower Costs: Quantify and cut down on wasted meeting hours.
  • Strengthen Collaboration: See how teams connect and where silos exist.

📌 Typical Use Case

A data engineering team spends 8–10 hours weekly in coordination calls. With Leanmote:

  1. Meeting patterns are automatically tracked from Google Calendar.
  2. Dashboards highlight that 40% of time is lost in recurring sessions.
  3. Leaders spot overloaded connectors and reduce meeting frequency.
  4. The team recovers focus time, improves delivery speed, and lowers coordination costs.

👉 The outcome: fewer but more effective meetings, better collaboration, and lower costs.

Bitbucket

Integrating Bitbucket with Leanmote

Introduction

This guide will help you generate an App password in Bitbucket, which is required to integrate your Bitbucket account with Leanmote. By following these steps, you will obtain the necessary credentials to connect Bitbucket with Leanmote and enable data synchronization securely.

Step 1: Access Bitbucket Settings

  1. Log in to your Bitbucket account.
  2. Click on your profile avatar in the top-right corner.
  3. Elegir Personal settings from the dropdown menu.

Step 2: Create an App Password

  1. In the left sidebar, click on App passwords.
  2. Click the Create app password button.
  3. Enter a Label for the password (e.g., “Leanmote Integration”).
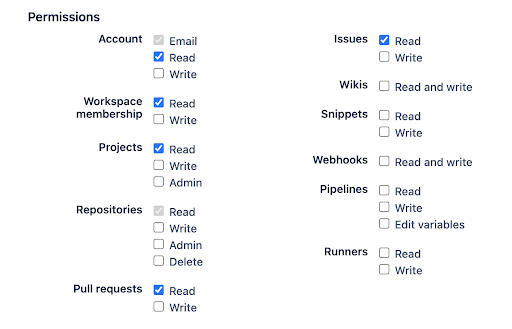
  4. Select the necessary Permissions required for the integration:
  1. Click Create.
  2. Copy the generated App password and store it securely. This password will only be displayed once.

Step 3: Add the App Password to Leanmote

  1. Log in to your Leanmote. account.
  2. Navigate to the Productivity Tools section.
  3. Elegir Bitbucket Integration.
  4. Paste the App password in the designated field.
  5. Click Save to complete the integration.

By following these steps, you will successfully integrate Bitbucket with Leanmote and enable secure data synchronization.

Jira

With this guide, you’ll be able to integrate Jira with Leanmote to centralise key project information and enhance productivity visibility and analysis.

Required Permissions

The user generating the token must have admin access to the projects.

Endpoints Used (read-only):

  • Get Issues: To retrieve metada about projects, epics, and tasks in Jira.

Follow the steps below to configure your token and connect both platforms. Let’s get started! 🚀


Integration Steps

How to find the token:

  1. Go to Manage Account
  2. Go to Security > API Tokens
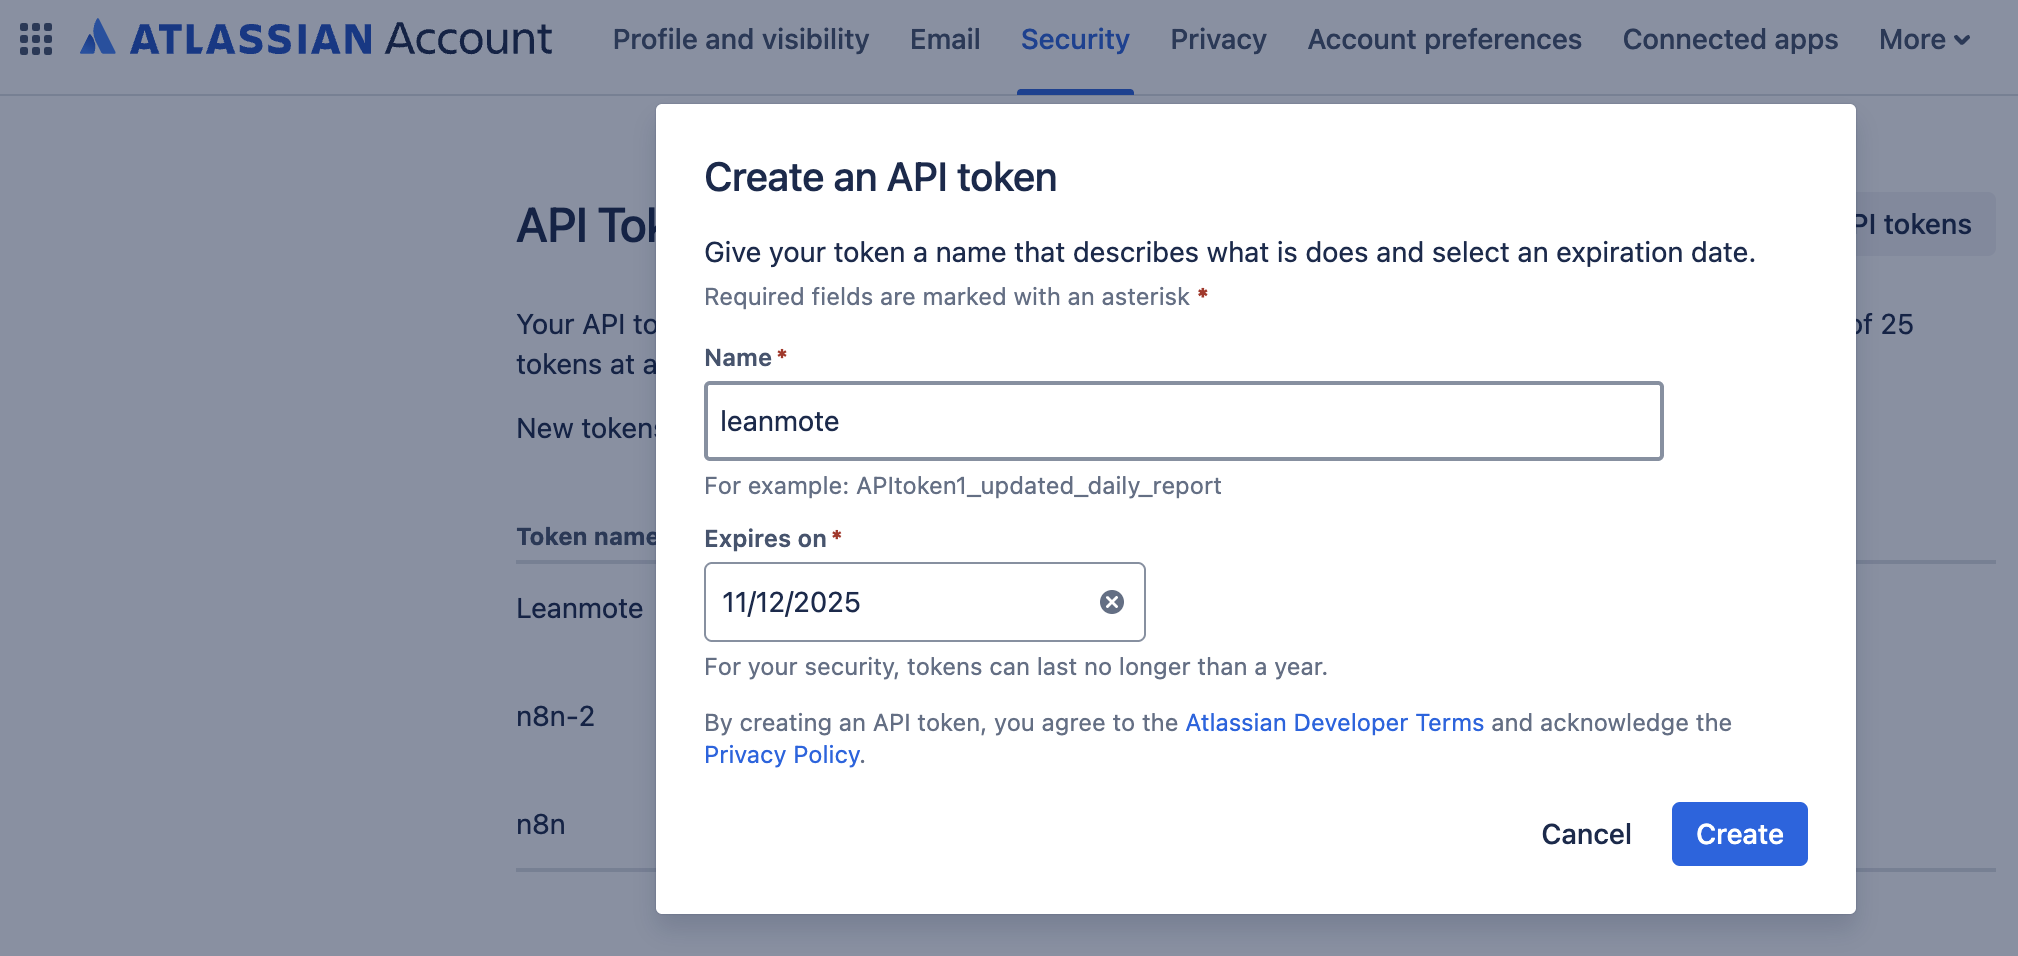
  3. Scroll down to API Tokens > Create and Manage API Tokens
  4. Click on Create API Token
  5. Set the expiration date to 1 year from the creation date.
  6. Click on Create and Copy Token
  7. Log in to Leanmote > Productivity Tools, click on “Connect” for Jira
  8. Enter the token, the email used, and the domain it was created for. Click “Save Changes”

Note: Make sure the email entered is the same one used to generate the token in Jira.

The token is automatically encrypted.

Done!

Any questions? Reach us

GitHub

🚀 ¿Para qué usamos esta integración?

La conexión con GitHub nos permite ofrecer información clave en tres áreas:

  • Métricas DORA (Software Delivery Performance):
    Miden la eficiencia del ciclo de entrega de software: Lead Time, Frecuencia de Deploys, Tiempo de Recuperación y Tasa de Fallos en cambios. Estas métricas son un estándar de la industria para evaluar y mejorar la performance de los equipos de desarrollo.
  • Team Collaboration:
    Visualizamos cómo interactúan los equipos en torno a PRs y revisiones, identificando cuellos de botella en la colaboración, tiempos de respuesta y balance de carga.
  • Team Activity:
    Desglosamos la actividad por miembro (commits, PRs creados, revisiones, comentarios) para obtener una vista clara de la contribución y las dinámicas de trabajo.

🔐 Permisos solicitados

Todos los permisos son permisos de lectura. Nunca solicitamos accesos de escritura ni permisos administrativos.

  • Metadata (read-only): listar repositorios y acceder a información básica.
  • Pull requests (read-only): obtener lista de PRs, commits asociados, revisiones y comentarios.
  • Contents (read-only): solo requerido si existen commits que no están asociados a PRs. not linked to Pull Requests.

📌 Endpoints utilizados


✅ Principio de mínimo alcance

En Leanmote seguimos el principio de privilegios mínimos:

  • Solo solicitamos permisos de lectura .
  • Nunca accedemos a permisos de escritura ni de administrador.
  • Cada permiso está estrictamente vinculado a un endpoint y a un propósito claro.

Leanmote’s data ethics & privacy: how we protect you

Security analysts protect internet-connected systems with shield. Cyber security, data protection, cyberattacks concept on white background. Pinkish coral bluevector isolated illustration

Giving the power of their own data to every user 

Working with data about people

Data ethics is necessary and should be in everyone’s mind when managing private information.

Numbers, rates, colors, and charts are shown on a dashboard and someone can easily forget that it’s insight about people.  That’s not our case.

Beyond the legal obligation, there is an ethical principle to protect access to personally identifiable information (PII).

At Leanmote we collect information to get to know people, understand them, and contribute to their wellbeing. Our objective is to provide the solution to companies to build better working environments in a world with growing complexities. 

How we collect and interpret information

We want to get to know people, without bothering them. That’s not an easy task when they are working, focused on what they have to do, maybe meeting deadlines, and dealing with pressures. 

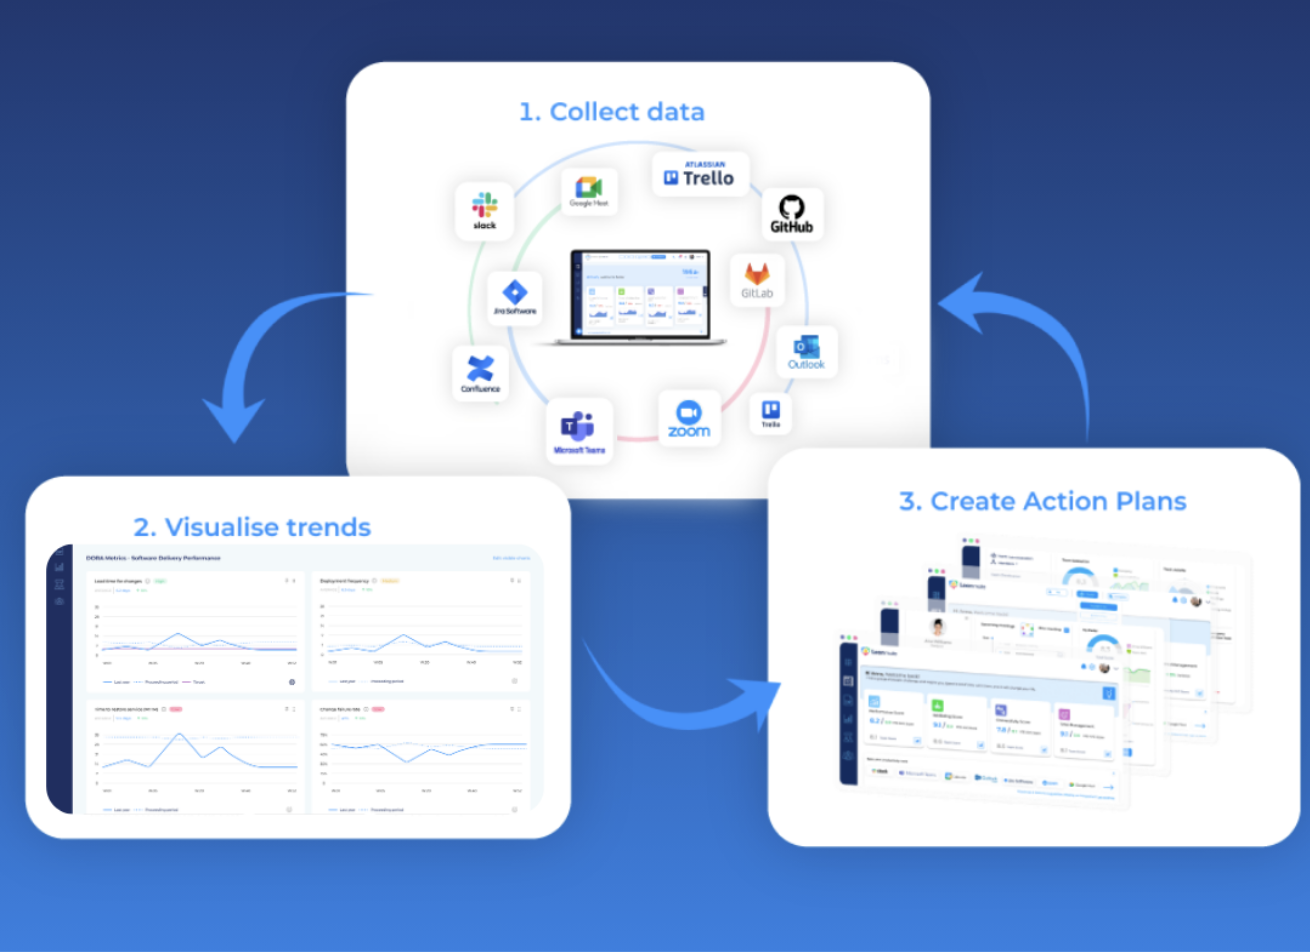
Leanmote offers an indirect way to collect data in addition to survey insight by connecting with productivity apps- like Slack, Jira, Google Meets, Teams and more- that the company already uses.

Understanding the general data lifecycle:

Image rights: A Beginner’s Guide to Data & Analytics, Harvard EBook.

 “A data project’s steps are often described as a cycle because the lessons learned and insights gleaned from one project typically inform the next. In this way, the final step of the process feeds back into the first, enabling you to start again with new goals and learnings”, A Beginner’s Guide to Data & Analytics, Harvard EBook.

Also, the value of the data improves when you connect as many apps as you can because we cross all the information. This enables Leanmote to offer a closer look to reality.

3 levels of showing data

Leanmote gives the power of managing data to every person that uses the platform.

User/Employee: sees its own data and chooses what’s shown to others.

Imagine that you are with the computer, at working hours and you receive an email from HR with a climate survey. You have to stop what you are doing, fill the form and send it. What happens with that information? Who sees it? Where does it go? 

With Leanmote, you can see this information. We enlighten people with their own data first, at real-time. When you accept to complete a survey or answer a question, you can instantly check it on the dashboard. In addition, anyone can go to settings and choose what to display for other members of the company. 

I complete a survey or answer a question, and instantly check it on my dashboard. In addition, everyone can go to settings and choose what to display for other members of the company.

Manager/Team Leader: each team decides how to show their information.

The manager sees the team’s information when there are four or more people on their team. Analyzing their team’s data in real-time, gives them the opportunity to unlock customized management and better lead their colleagues. 

C-Level/ People and Culture Leader: sees the protected and aggregated information at every team or department level

They can access all data but they don’t have unlimited power. Everyone has the control of their own data. This level analyzes the information that each team of the company chose to give. 

Our 6 ethical principles

⭐Your data is yours. We don’t share it with anyone else. 

⭐You choose what to share and with whom. 

⭐You connect Leanmote with your working apps.

If we detect that someone is stressed, we send options about what to do with the situation to that person. We don’t send it to the manager so that it can decide over someone’s personal moment. 

As Leanmote is API based, the more you connect your apps with the platform, the better information it will collect. This way, Leanmote can be your frictionless and single source of truth.

This principle is about honesty and consent, making sure that the user understands and accepts what type of data we collect. 

Users know from day one that we are constantly gathering data and we give them the control of it. They can check their data and choose not to share it on the same platform. Also, we are transparent about why Leanmote collects information.

Leanmote ensures a strong security to all your data. We know that we handle important information that requires the highest levels of protection. 

The platform has multiple-factor authentication: password, push notification and Google Authenticator. Also, all data is stored in Amazon Web Services (AWS) which provides safety and strict privacy. 

Each user can choose what to show and only the company can see it.

If we talk about ethics, we should talk about intentions. Our intentions are good, Leanmote provides companies with their people data to enhance their working experience. We collect only the data that is useful for this purpose.

What do we mean by enhancing the daily working life of people? To give information so organizations can make intelligent decisions towards their employees. For example, with data we can prevent isolation, burnout, discontent, misunderstandings and more.

It’s all about the context! The holistic point of view that we offer is important to interpret data. 

We provide information to analyze the state of human interaction at work. The variety and amount of information that it’s collected let us give accurate data about all users.

We accept feedback because we want to do better every time. If you detect any mistake, please contact us to point it out.

Terms based on these principles

Before you start using the platform, you can see our Privacy Policy and Terms of Service. We have based our terms with these ethics criteria. Check it out!

Monday.com

Summary

This plugin collects monday.com data through Monday’s API.

Configuration

Connection

To integrate this plugin, you first need to obtain a token from Monday.

Follow these steps to generate a token with the required permissions.

Once you have your token, navigate to Leanmote > Administration > Productivity Tools.

There, click on “Connect” and input your token.

Mapping

After adding your token, we will map your team’s properties to the following elements:

  • Task Properties: Specify which fields represent the task’s status, due date, and owner.
  • Boards: What boards Leanmote will collect data from.
  • Task Status: Identify whether a status represents backlog, active, waiting, or completed tasks.
  • Task Lifecycle: Define which statuses signify the start and end of tasks.

Sync Policy

We extract data once a day from Monday.

Metrics

Metrics that can be calculated based on the data collected from Jira:

  • Flow Efficiency
  • Time to Market
  • Active Time
  • Waiting Time
  • Cycle Time
  • Throughput
  • Work in Progress (WIP)
  • Average Age of WIP

Por qué las métricas DORA no son suficientes: Un enfoque mejor de la productividad de los equipos de ingeniería

Las métricas DORA, o DevOps Research and Assessment metrics, son como varas de medición utilizadas en el desarrollo de software para evaluar el desempeño de los equipos. Estas métricas analizan qué tan rápido se está desarrollando el software y con qué frecuencia presenta fallos. Aunque son útiles, no siempre cuentan toda la historia.

Más allá de las métricas DORA

¿Tienes tu propio panel de métricas DORA? Está bien, es excelente para señalar problemas, como si hay una gran desaceleración en el proceso de trabajo. Pero aquí está el problema: no te dice cómo solucionar los problemas que encuentra. Es como ir al médico, descubrir qué está mal, pero luego tener que encontrar la cura por tu cuenta.

Ahí es donde entra Leanmote. No se basa únicamente en las herramientas de métricas DORA; también analiza la dinámica del equipo para obtener una imagen más clara. Recopila datos de herramientas como GitLab y Jira, donde los desarrolladores trabajan en el código y rastrean el progreso. Pero no se detiene ahí. También analiza herramientas cotidianas como Slack y Google Calendar para ver cómo los equipos se comunican y coordinan su trabajo.

Repensar las métricas y el contexto

La productividad no se puede medir únicamente a través de las herramientas de productividad de los desarrolladores y las encuestas. Esto puede no proporcionar una comprensión completa de cómo operan los desarrolladores, porque no se trata solo de la codificación, sino también del contexto en el que estás trabajando. ¿Qué pasa con los chats? ¿Qué pasa con las herramientas de gestión de proyectos, los tickets asignados y el número de eventos en el calendario?

Si bien las herramientas de productividad y las encuestas ofrecen ideas valiosas, deben complementarse con un conjunto más amplio de métricas para capturar las complejidades del trabajo. Estos podrían ser reuniones de lluvia de ideas o momentos colaborativos.

En un informe reciente de 2024 Global Human Capital Trends de Deloitte, se destaca la necesidad de repensar las métricas de productividad tradicionales. Este informe afirma que las organizaciones están mejorando en el seguimiento de cómo las personas trabajan y qué las hace desempeñarse mejor. Esto se debe a que pueden recopilar, medir y analizar datos mucho más rápido que antes. Luego, pueden usar el aprendizaje automático o el juicio humano para convertir estos datos en consejos útiles. Por ejemplo, pueden usar un método llamado análisis de redes organizacionales para ver cómo las personas en una empresa se conectan y trabajan juntas.

Las métricas reales que necesitas

Para obtener una visión holística, consideramos tres áreas críticas de medición:

Rendimiento: pasa de la incertidumbre sobre la eficiencia del equipo a obtener información a través de métricas como puntos de historia y duración del tiempo, lo que nos permite priorizar tareas, justificar retrasos y mejorar la calidad al abordar problemas como errores e incidentes.

Eficiencia del tiempo: la falta de estructura en las reuniones y el tiempo invertido afecta la carga de trabajo y la eficiencia. Al rastrear el tiempo, Leanmote hace visible la alineación y encuentra formas de mejorar la gestión del tiempo.

Conectividad: Conectividad Interna: No saber por qué alguien tiene baja actividad en solicitudes de extracción es un problema. Rastrear su tiempo de fusión y mejorar las conexiones del equipo aumenta la productividad.

Conectividad Externa: Medir la complejidad del proyecto por la participación de las partes interesadas. Identificar los costos de alineación, el número de partes interesadas en los sprints y los niveles de compromiso facilita la gestión del proyecto.

Pero (sí, hay un "pero"), no se trata solo de establecer métricas. Se trata de encontrar el equilibrio adecuado entre diferentes aspectos para garantizar un entorno de desarrollo sostenible y productivo. A estas, hay que añadir las contramétricas, por ejemplo:

Rendimiento vs. Conectividad: Carga de trabajo. Si tienes muchos stakeholders, esto impactará en tu carga de trabajo, ya que necesitas alinear muchas cosas.

Rendimiento vs. Eficiencia del Tiempo: Trabajar más allá del horario regular afecta la productividad. ¿Cuántas reuniones se realizan por sprint?

Entrega vs. Rendimiento: Si sé que necesito aumentar la frecuencia de implementación pero tengo una carga de trabajo pesada y muchos stakeholders, debo tener eso en cuenta. DORA te dice qué está pasando hoy, pero no el porqué. Leanmote te dice el porqué: si el proyecto es más grande, si hay muchas personas involucradas, si hay muchos tickets, etc.

Lleva soluciones a tu equipo en lugar de problemas

Con todo esto, Leanmote proporciona a los líderes una comprensión más clara de la dinámica de su equipo. En lugar de confiar en conjeturas o preguntar constantemente al equipo qué está mal, los líderes pueden simplemente revisar la función de Gestión de Delivery para identificar problemas.

Yendo más allá, Leanmote ofrece la función de Diagnóstico de Equipos y brinda información cuantificable para entender por qué no se están cumpliendo los objetivos. Finalmente, cuentas con LeanOps que ayuda a los líderes a elaborar planes de acción y tomar decisiones inteligentes para resolver los problemas que están frenando a tu equipo. 

Con Leanmote, los líderes pueden tomar decisiones informadas con confianza, fomentando una cultura de innovación y colaboración. No más conjeturas ni culpabilizaciones; Leanmote empodera a los líderes para guiar a sus equipos hacia el éxito con datos fiables y completos.

Discord

Welcome to Leanmote’s Discord integration – a game-changer for evaluating team connectivity. Gain valuable insights into message volumes, group interactions, message timing, and chat statuses, all designed to enhance your team’s communication dynamics. Elevate collaboration with Leanmote’s streamlined approach to team analysis.

What does our Discord integration do?

Leanmote will collect passive data on team interactions, aiding in the evaluation of your team’s connectivity and communication. We collect:

  • Number of messages between peers
  • Number of messages between peers in a group
  • Time/hour of the messages
  • Chat status

How to start collecting data from your Discord server:

  1. Install our Discord bot on your server by clicking the Discord bot card on Settings – Company’s integrations.
  2. Each user on your team should save their Discord username on Settings – Integrations inside the Discord bot card.

Important: The Discord username is not the same as the display name. You can find your username inside your Discord settings. In this example, the username is “this.is.a.username.2024,” which is the one the user should save on their Integrations tab.

Metrics Glossary